Quantitative Research: Definition, Methods, Design and Analysis
Quantitative research plays an essential role in scientific and academic research. By enabling numerical data to be measured and analyzed with precision, quantitative studies provide objective and generalizable results, often unattainable by qualitative methods. A student who undertakes a quantitative survey as part of his or her dissertation or thesis acquires crucial skills such as analytical rigor, mastery of statistical techniques and the ability to interpret numerical data. In this way, they can make a significant contribution to their field of research.
What is quantitative research?

Definition, objectives and benefits of quantitative research
Quantitative research definition according to Survey Monkey: “Quantitative research is a methodology that provides support when you need to draw general conclusions from your research and predict outcomes. These methods are designed to collect numerical data that can be used to measure variables. ”
The advantages of the quantitative research include:
- the possibility of obtaining objective, reliable data,
- the application of rigorous statistical models
- the ability to make comparisons on a large scale and over time,
- the ability to reveal causal relationships between variables, thus providing a basis for decision-making.
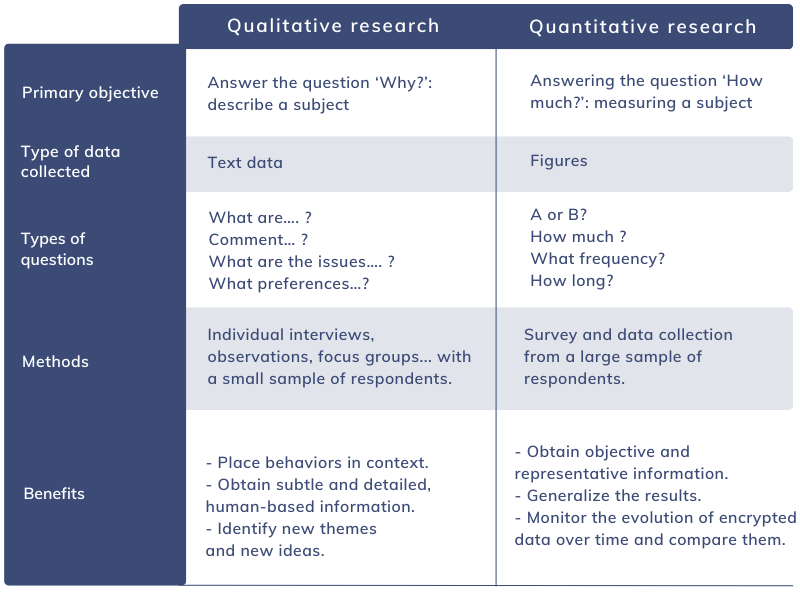
Differences between qualitative and quantitative research
Which data collection methods for a quantitative research?

Primary collection using surveys/questionnaires
Primary data collection means that the researcher collects data directly from the sample, without relying on data collected in previous quantitative surveys. Questionnaires are the most common method used in quantitative research. They can be administered online, by telephone or in person to large population samples. Standardized questionnaires guarantee uniform data collection, delivering statistically significant results.
Primary data collection in longitudinal studies
Longitudinal studies follow the same participants over a long period, offering insights into evolutions and trends over time. They are particularly useful for studying changes in behavior, attitudes or conditions over different phases.

Primary collection by experimental research
Primary collection by experimental research involves the deliberate creation and manipulation of variables in a controlled environment to observe their direct effects on other variables. This method enables researchers to test specific hypotheses and establish cause-and-effect relationships with great precision.
“In this method, the theory being studied has not yet been proven; it is merely speculation. Thus, an experiment is carried out to prove or disprove the theory.” Voxco, Quantitative research: Definition, methods and examples
This approach is particularly useful for studies where internal validity and methodological rigor are crucial.

Secondary analysis of quantitative data
Secondary data analysis uses existing databases to re-analyze information and answer new research questions. This method is effective in fully exploiting available data, and can reveal additional insights without the need for new data collection.
How to run a quantitative study?
Defining quantitative research objectives
The first step in designing a quantitative study or quantitative research is to clarify the research objectives. This involves determining what the quantitative research seeks to achieve and the specific questions it aims to answer. These objectives will guide the entire research process.

Choosing the data collection method
Depending on your research objectives, choose the most appropriate data collection method. This is what we developed in the previous section.
Select the sample
The representativeness of the results will depend on the selection of the sample. Determine the necessary size and the sampling method (random, stratified, etc.) to ensure that the sample accurately reflects the target population.

Design measurement instruments
Design measurement instruments, such as questionnaires or experimental protocols, that are clear, precise and adapted to the study objective. Questions should be formulated in such a way as to minimize bias (mostly closed-ended questions) and easily yield usable figures.
Planning quantiative data analysis
Before collecting data, plan how it will be analyzed. This includes selecting appropriate statistical techniques and using data analysis software. Advance planning ensures that the data collected will answer the research questions validly and reliably. In a professional setting, incorporating task management tools into your planning process can streamline quantitative data collection and analysis, ensuring that each step is executed efficiently and effectively.
How to successfully perform quantitative analysis and data reporting?

Checking and cleaning quantitative data
Before starting analysis, it’s important to ensure that data is complete and error-free. Identify and manage missing data, correct anomalies and eliminate duplicates, while guaranteeing the integrity of the information.
Initial exploration of quantitative data
Perform initial data exploration. Analyze measures of central tendency (mean, median) and dispersion (standard deviation, variance). Use visualizations such as histograms, whisker boxes and scatter plots to detect trends, distributions and possible anomalies.

Selecting quantitative methods
Select the appropriate quantitative methods according to your research objectives and the nature of the data.
- For comparisons between groups, use tests such as the T-test or ANOVA.
- To analyze relationships between variables, consider regression techniques.
Analysis and interpretation of results
Interpret the results in the context of your study. Relate the findings to the original hypotheses and discuss their relevance to the research question. Consider the practical and theoretical implications of the results, as well as their limitations and potential implications for future research.
Clear, visual presentation of quantitative results
Use tables and graphs to illustrate your quantitative results in a concise and accessible way. Make sure visualizations are well-labeled, understandable and directly linked to key findings. The visual aspect helps to communicate results effectively and convincingly.
It’s also vital to document each stage of the analysis in detail in a quantitative survey report. Include :
- a methodological description
- analysis results
- visualizations
- your interpretations.
A well-structured report validates the rigor of your analysis and makes it easier for other researchers to understand and reproduce your results.
Quantitative research represents a fundamental pillar in the world of research, offering powerful tools for the collection and analysis of objective data. Using rigorous quantitative methods and advanced statistical techniques, they deliver reliable, generalizable results that are invaluable for decision-making. Whether designing surveys, analyzing data or presenting results, a well-planned and executed quantitative approach can not only strengthen the validity of findings, but also enrich the overall understanding of the research field. By mastering these skills, researchers and students make a significant contribution to the advancement of scientific knowledge.
If you’re using quantitative research as part of your thesis, don’t forget to analyze your deliverable in a plagiarism checker to avoid any risk of plagiarism.
➡️ See also our guide to conducting qualitative research.
Discover other practical guides to conducting effective quantitative research:
- Types of quantitative research, Lyssna
- Quantitative Research Methods, Nova Southeastern University
- A Guide To Conducting Great Quantitative Research, EngageSpark
Information: This informative article was written in part with the help of ChatGPT. The content generated by AI has been reworked to check the veracity of the information, the relevance of the instructions and to add clarifications.
What are the quantitative studies?
Quantitative studies use numerical data and statistical methods to understand and analyze phenomena. They gather information via surveys, questionnaires and experimental tests, making it possible to quantify variables and identify patterns or correlations.
What's the difference between qualitative and quantitative research?
Quantitative studies analyze numerical data using statistical methods to identify trends, developments and correlations. Qualitative studies, on the other hand, explore phenomena through non-numerical data, such as interviews and observations, to understand experiences and perceptions in depth.
Why conduct a quantitative study?
To quantify variables, identify trends and obtain generalizable results through measurable data and statistical analysis.
Was this article helpful?

Mohamed BADI
Committed to academic integrity and authenticity, I help students and teachers understand and prevent the risks associated with plagiarism and generative AI.